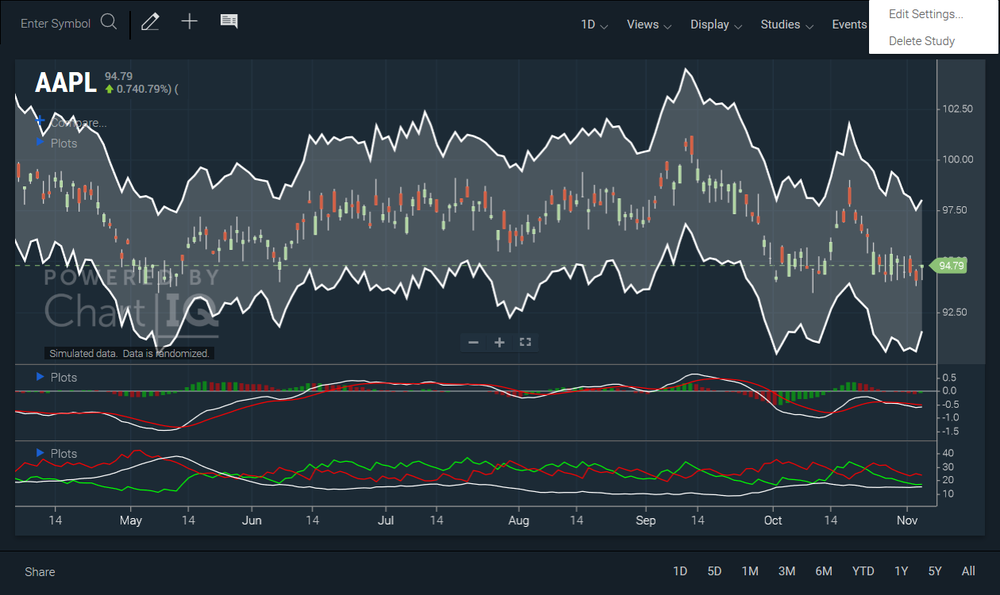
ChartIQ is an innovative financial charting solution that simplifies the analysis of complex market data through advanced data visualization and algorithmic trading capabilities, enabling traders and analysts to execute swift, informed decisions. With its intuitive interface and robust crypto support, it enhances market performance and efficiency for financial professionals.
The list of ChartIQ Alternatives based on features, pricing, user votes, specification and other factors.
Showing 1 - 25 of 36 alternatives
Innovative data exploration tool with interactive visualizations and filtered views for effortless insight discovery.
Powerful data modeling software with visual discovery and analytics capabilities for enhanced data quality and informed business transformation.
Transformative telecom solutions with advanced analytics and visual discovery for optimized operational efficiency and exceptional communication experiences.
Innovative financial modeling software with advanced analytics and simulation models for streamlined decision-making and error-free insights.
Versatile reporting tool with customizable dashboards and advanced analytics for effortless data insights and decision-making.
Effortless web reporting tool with interactive dashboards and OLAP functionality for instant data insights without any coding.
Powerful data visualization software with simulation models and statistical analysis for insightful decision-making.
Powerful analytics platform with visual discovery and filtered views for actionable insights without compromising user privacy.
Transformative Excel add-in with data visualization and analytics tools for seamless, insightful data management and decision-making.
Dynamic storytelling tool with a drag-and-drop editor and visual discovery for captivating audience engagement.
Dynamic data visualization tool with dashboard creation and filtered views for insightful decision-making.
Transformative analytics platform with intuitive dashboard creation and deep insights for data-driven decision-making.
Powerful data exploration tool with intuitive no-code visualization and advanced SQL capabilities for effortless insights and interactive dashboards.
Powerful IDE with analytics and dashboard creation for streamlined data management across 40+ platforms.